

master. It never shows logs from other projects.
Sources
Logs cover two kinds of activity:- Core GraphQL — requests that reach your project’s GraphQL API.
- Custom Function — output from your custom functions.
The Logs screen
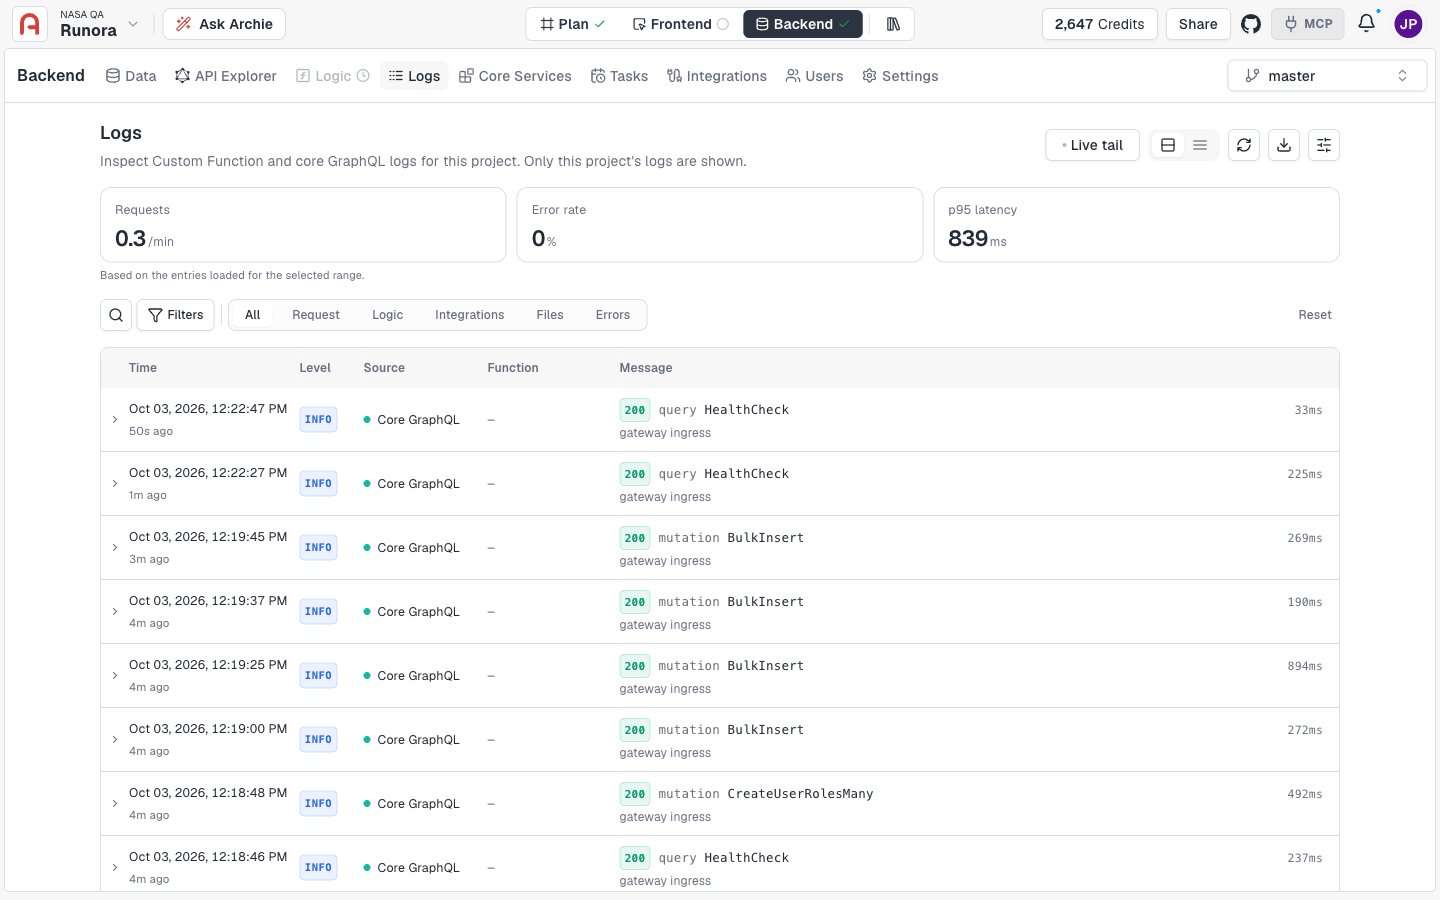
- Actions — Live tail, a Comfortable / Compact density toggle, Refresh, Export, and Log settings.
- Metrics — three cards that summarize the entries on screen.
- Search and filters — a search box, a Filters panel, category tabs, and Reset.
- Table — one row per entry, with Time, Level, Source, Function, and Message columns.
query or mutation), the operation name, the latency, and a short text such as gateway ingress.
At the bottom of the table, Rows per page sets how many entries you see at once (10, 25, 50, or 100). A counter such as “Showing 1 to 25 of 69 entries” shows where you are in the results.
Metrics
Three cards sit above the table:The metrics use only the entries loaded for the selected range. When you change the time range or apply a filter, the numbers change with it.
Search and filter
Search
Select the magnifying glass to open the search bar. Pick what to search with the selector on the left:- Message searches the message text.
- GraphQL searches GraphQL requests, for example by operation name.
Category tabs
The tabs above the table narrow the list to one category of entry: All, Request, Logic, Integrations, Files, and Errors. A tab with no matching entries shows No logs found.Filter by level, source, and time
Select Filters to open the filter panel.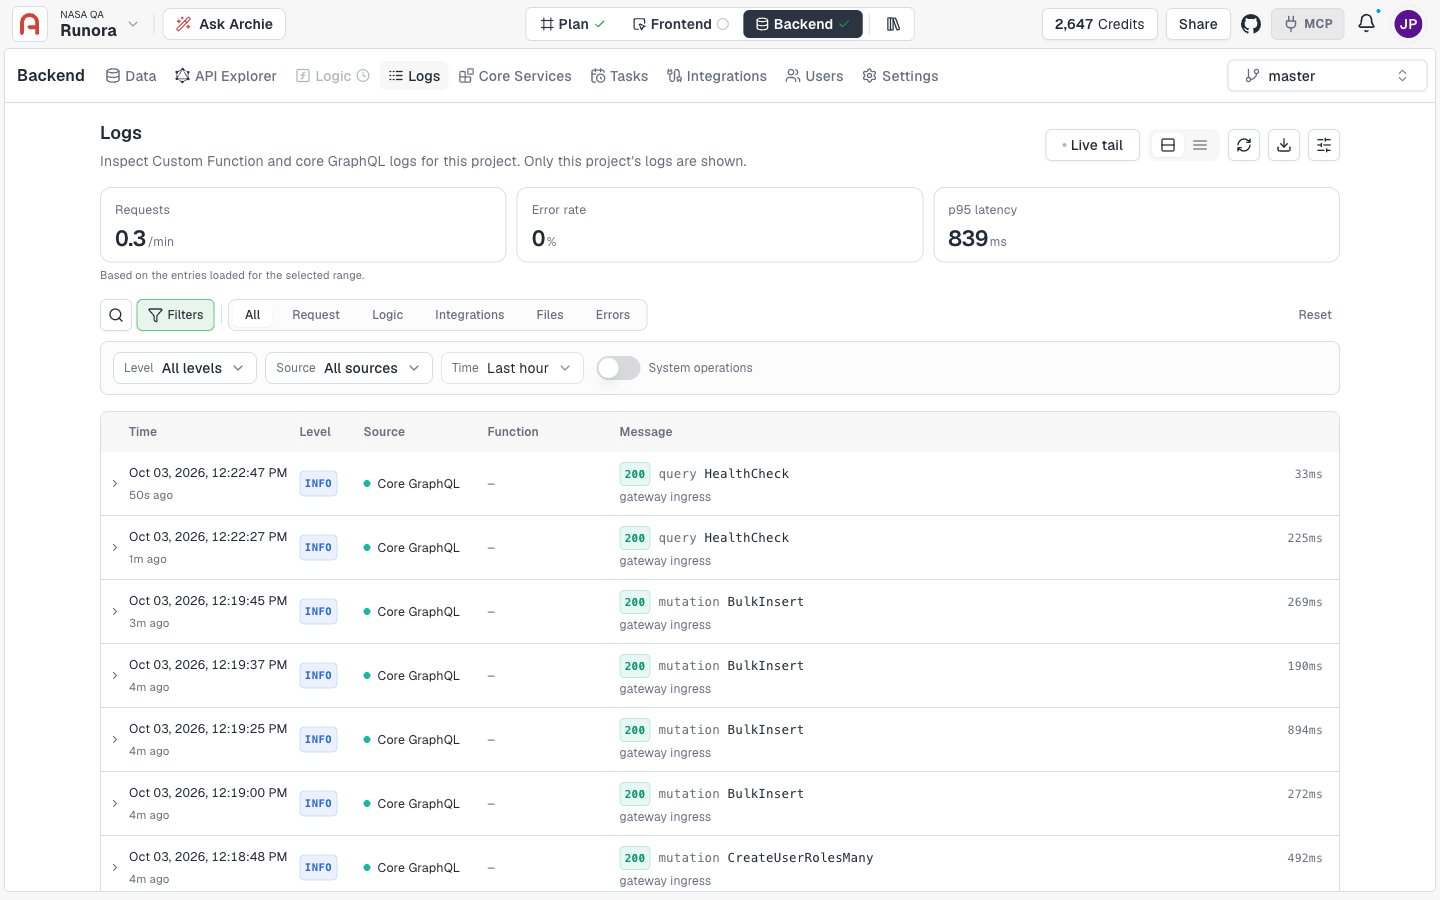
Turn on System operations to include system-generated operations, such as
GetDatabaseTables and QueryTable. These entries are hidden until you turn the toggle on, so the entry count goes up when you enable it.
Read an entry
Select a row to expand it. The detail shows:- Status — the HTTP status code.
- Operation — the operation type and name.
- Fields accessed — the top-level GraphQL fields the request touched.
- Method — the HTTP method.
- Latency — how long the request took.
- Path — the request path, for example
/graphql. - User — the user the request ran as.
- Raw event — the full entry as JSON.
Live tail
Select Live tail to watch new entries arrive without refreshing. A LIVE badge appears next to the page title and the button changes to Live. Select Live again to stop. Select Refresh to load the latest entries on demand.Change the row density
Use the density toggle to switch between Comfortable and Compact. Compact fits more rows on screen by shortening each row.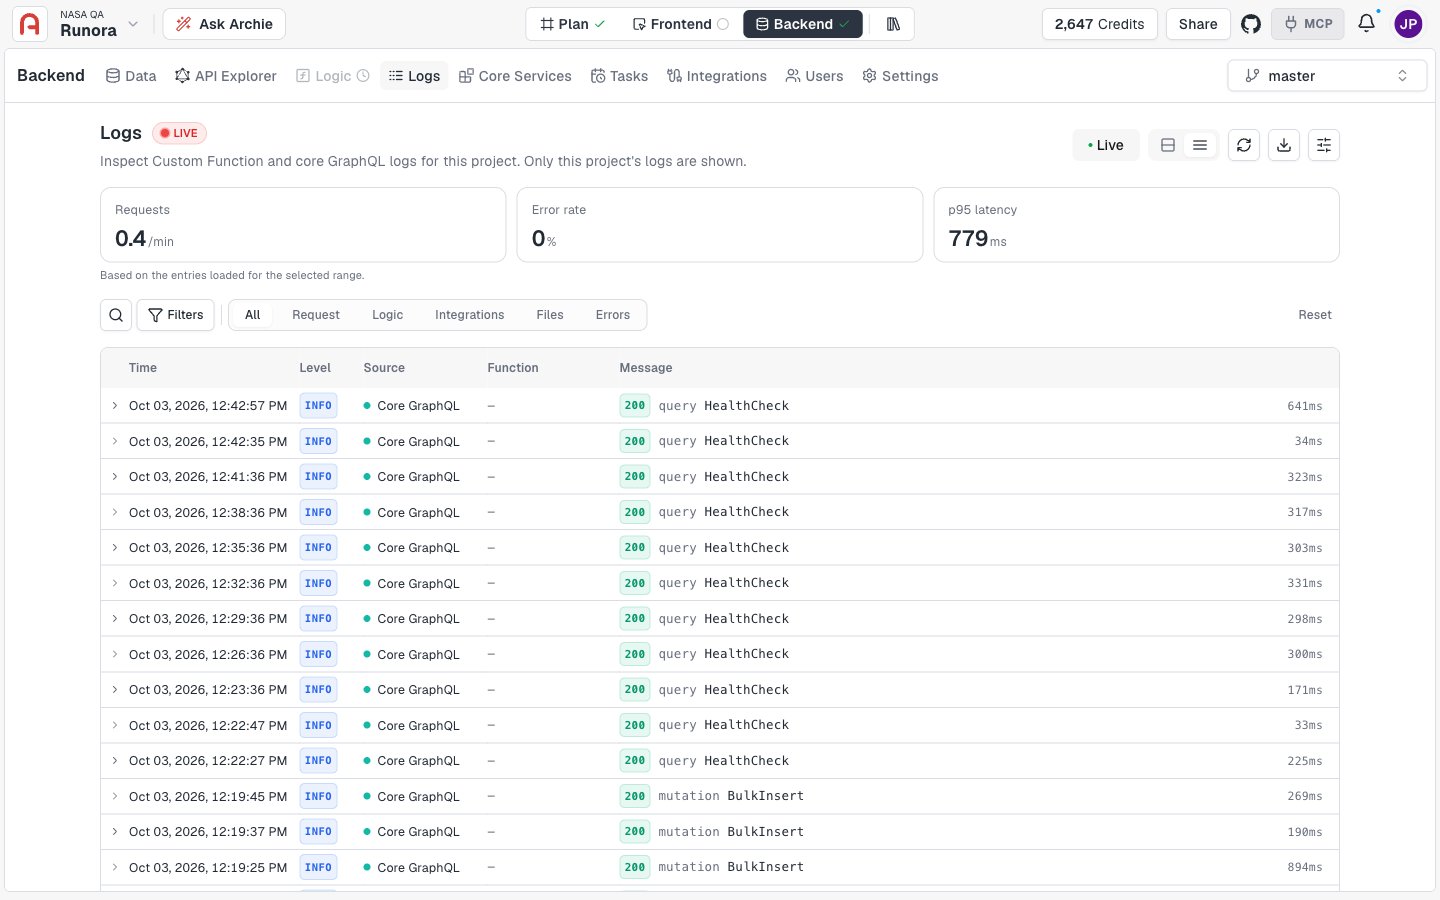
Export
Select Export to download the entries in the current view. The menu offers Download JSON and Download CSV, and each option shows how many rows it will include.Log settings
Select Log settings to open the settings drawer.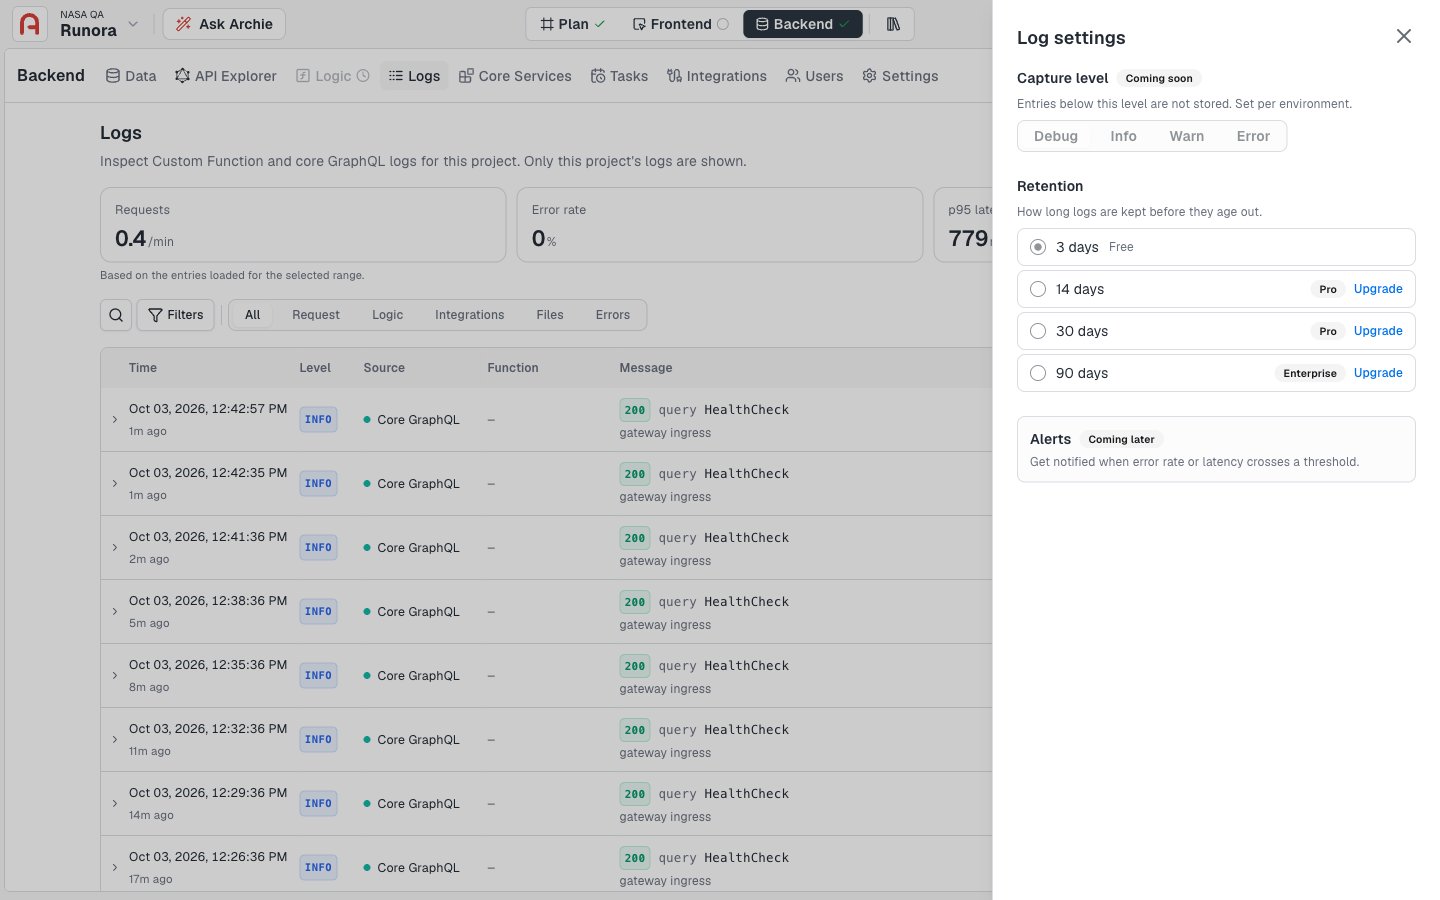
Capture level
Capture level sets the lowest level Archie stores: Debug, Info, Warn, or Error. Entries below the level are not stored. You set it per environment.Capture level is marked Coming soon. You can see the control, but you can’t change it yet.
Retention
Retention sets how long logs are kept before they age out. The option you can use depends on your plan:
Your current retention is selected. Options your plan doesn’t include show an Upgrade link.
Alerts
Alerts will notify you when the error rate or latency crosses a threshold. It’s marked Coming later.FAQ and troubleshooting
Why don't I see my logs?
Why don't I see my logs?
Check these in order:
- Confirm you’re in the right project and environment. Logs are scoped to both.
- Widen Time. The default is Last hour, so older entries stay hidden until you choose a longer range.
- Select Reset to clear any search, category tab, or filter.
- Check Source and Level. A narrow selection can hide the entries you want.
- Turn on System operations if you expect entries from system-generated requests.
- Select Refresh to load the latest entries.
Why are the metrics different after I filter?
Why are the metrics different after I filter?
The metrics describe the entries loaded for the selected range. A different time range, search, or filter changes which entries are loaded, so the numbers change too.
Can I see logs from other projects or environments?
Can I see logs from other projects or environments?
No. Logs shows only the current project, and the environment selected in the Backend Console.
Where do I look when a scheduled task fails?
Where do I look when a scheduled task fails?
Start with the task’s run history. It links to the full request and response in Logs.