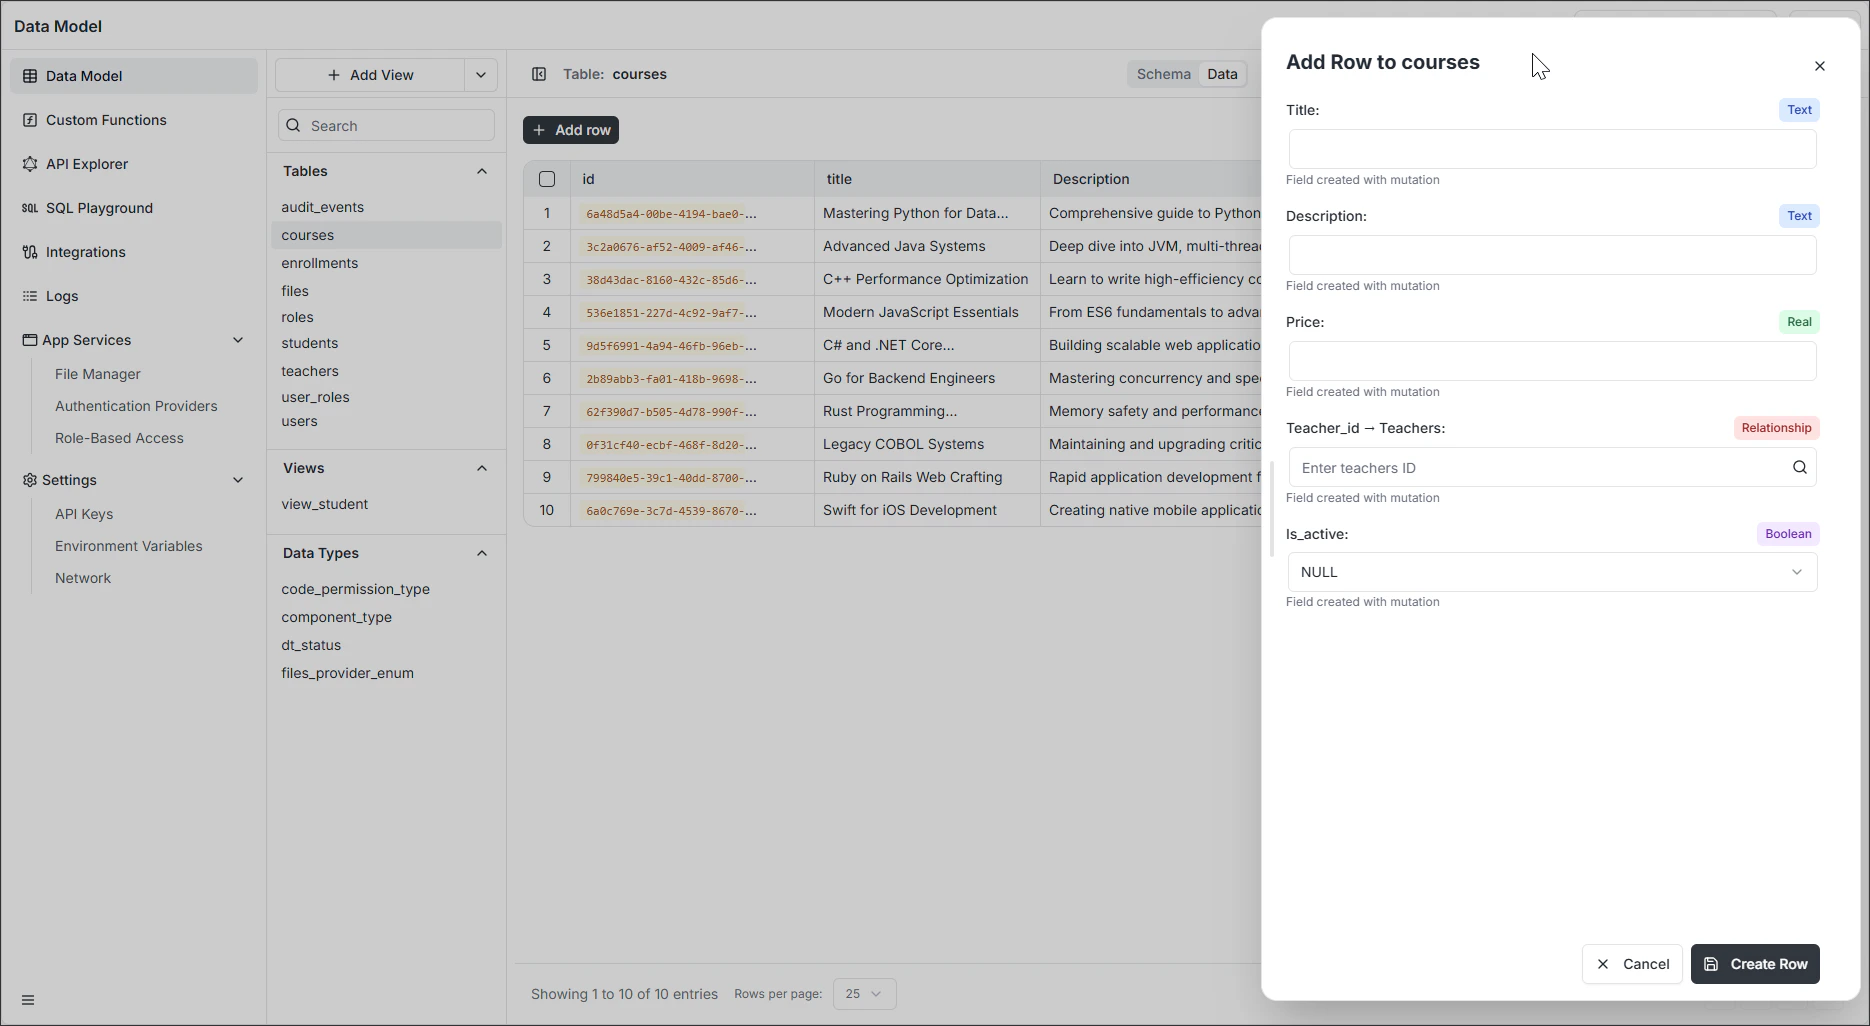
Adding a row
Click + Add row
The button sits in the top-left of the toolbar. A form opens with all the table’s fields.
Fill in the fields
Required fields are marked. Validation runs as you go — uniqueness, type, and constraint errors appear inline.
Editing a row
Click any row in the grid to open the edit form, update the fields, and click Update Row. As with adding a row, schema validations run before the change is saved.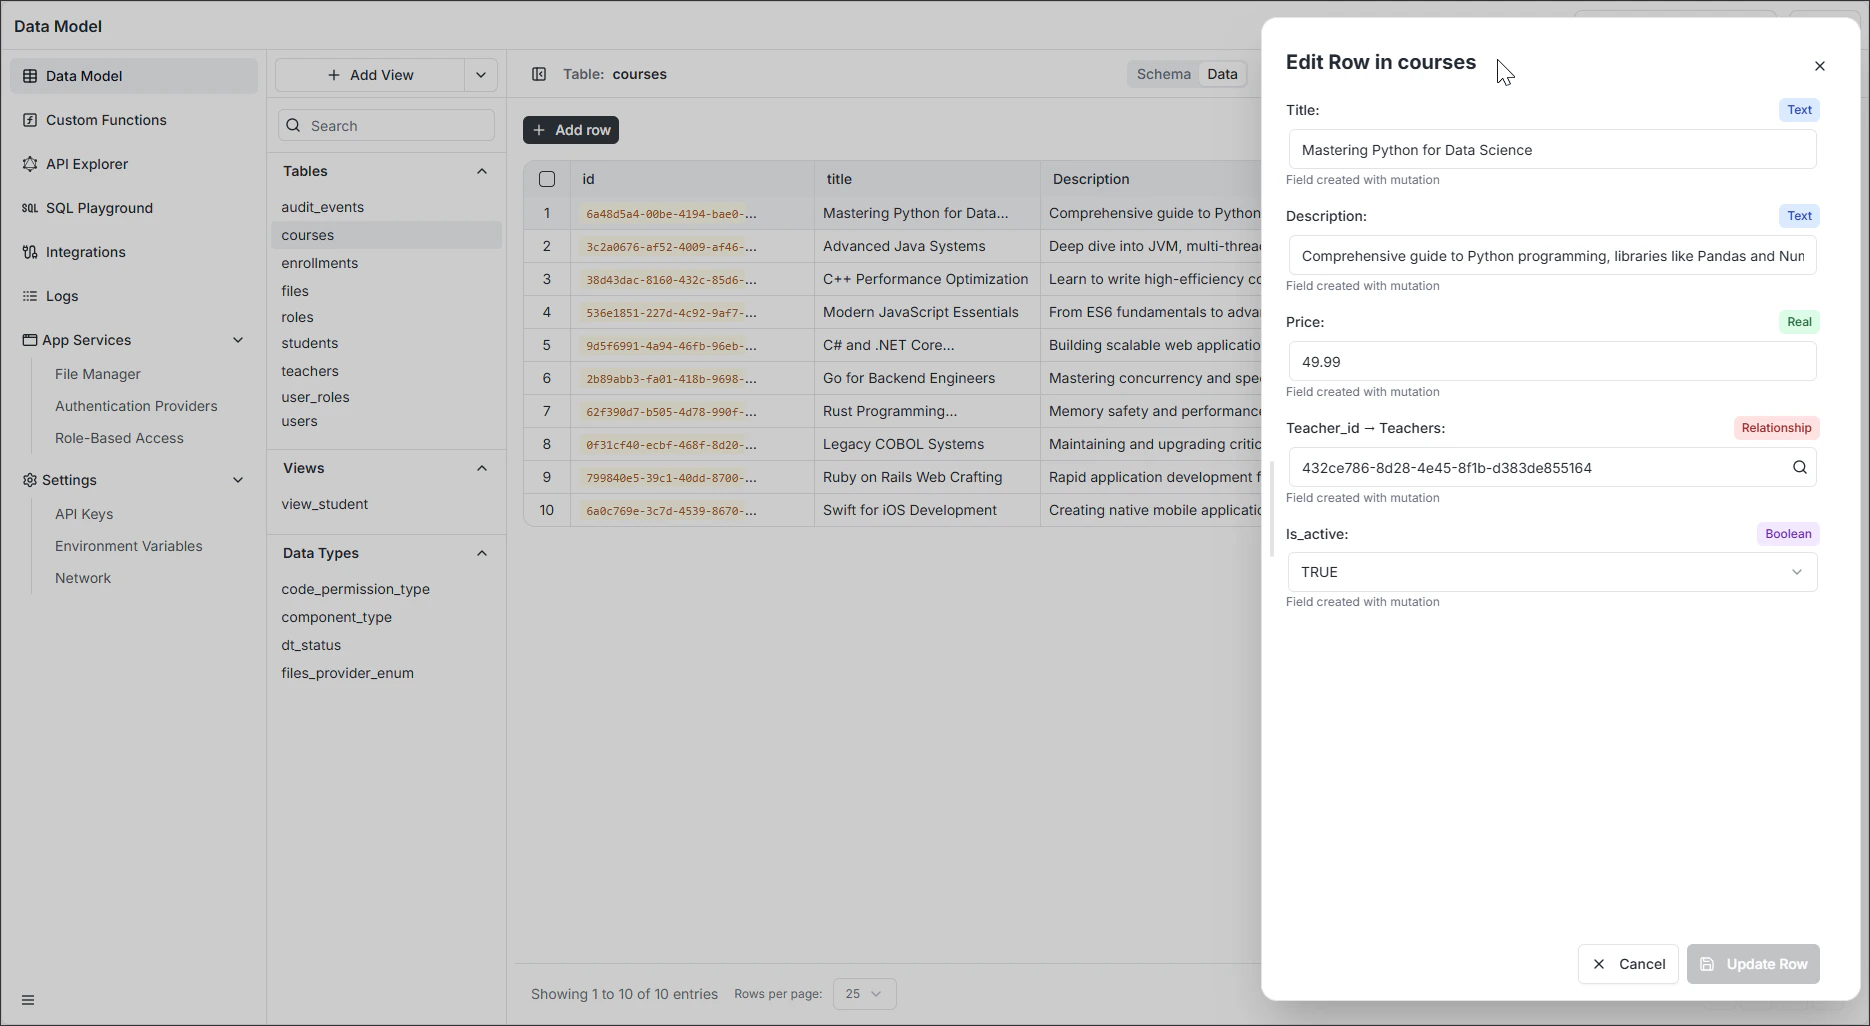
Deleting a row
Right-click the row you want to delete and choose Delete Row from the context menu. Confirm in the dialog that appears.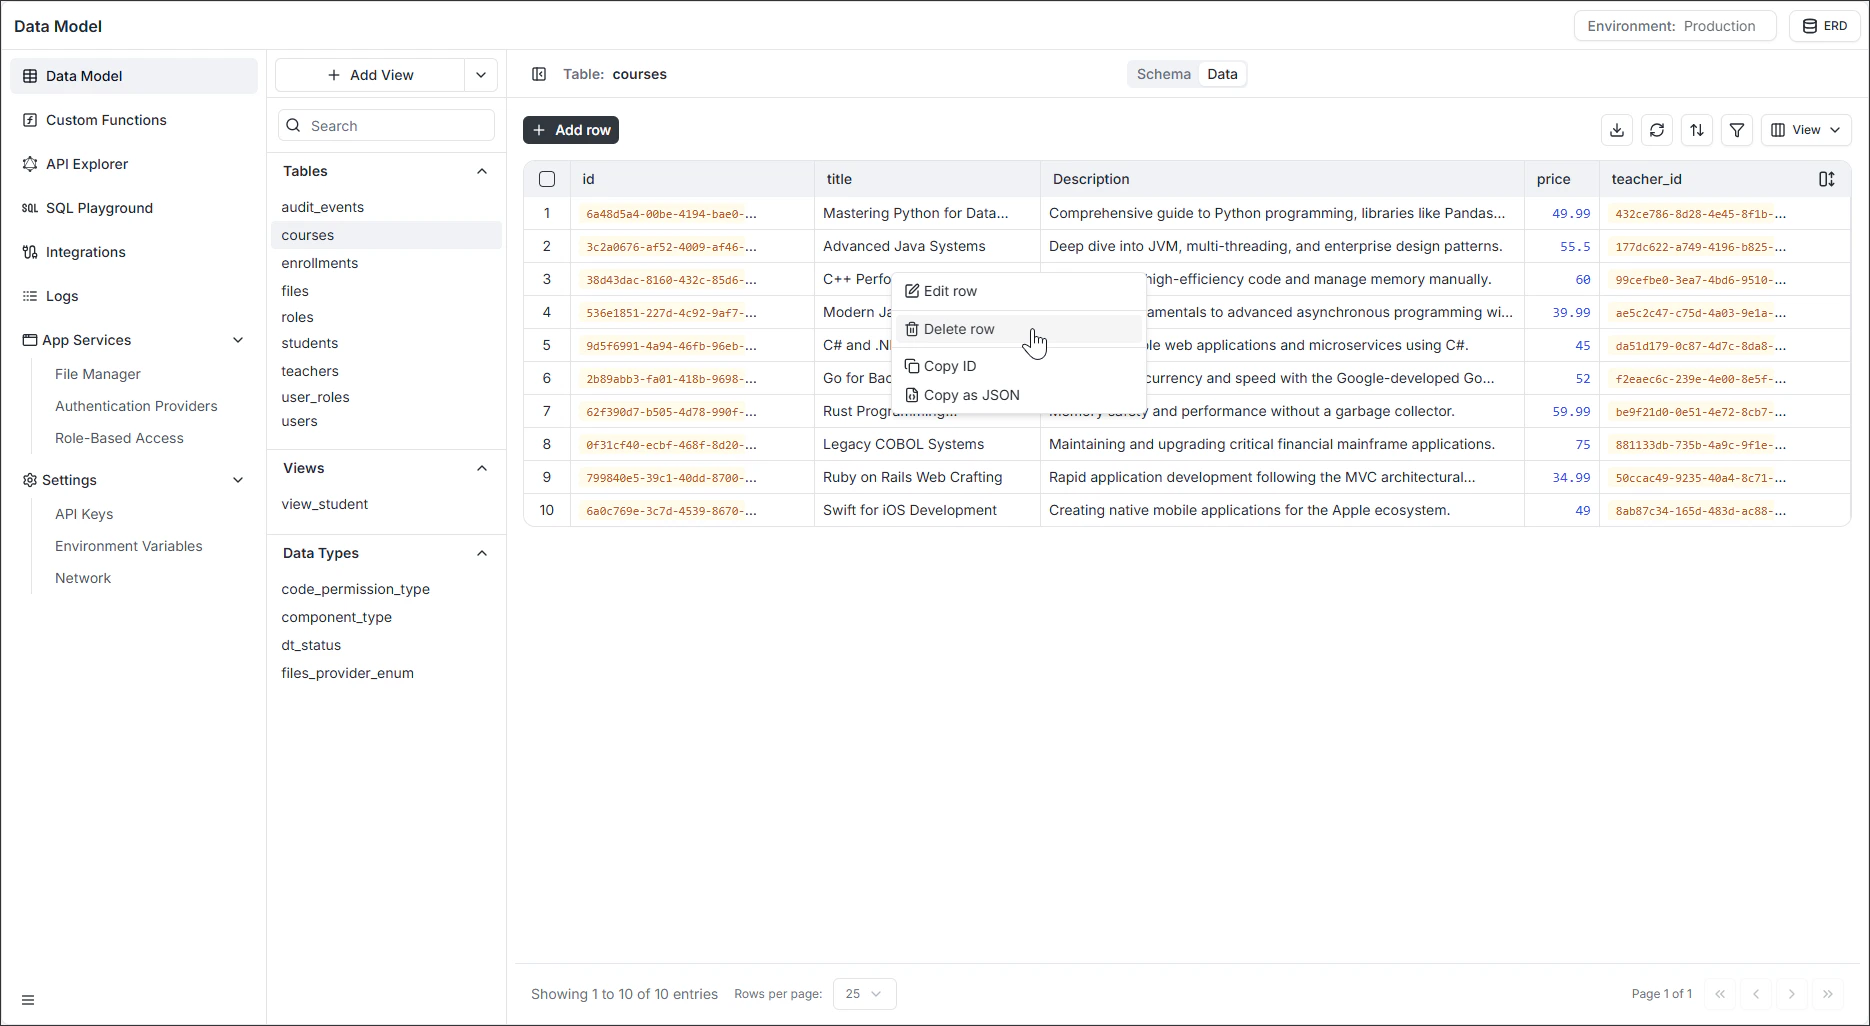
Filtering
Click the Filter icon (funnel) in the toolbar to add filters. You can stack multiple filters — for example, “is_active = true AND created_at > 2025-01-01”. The grid updates as you add and remove filters.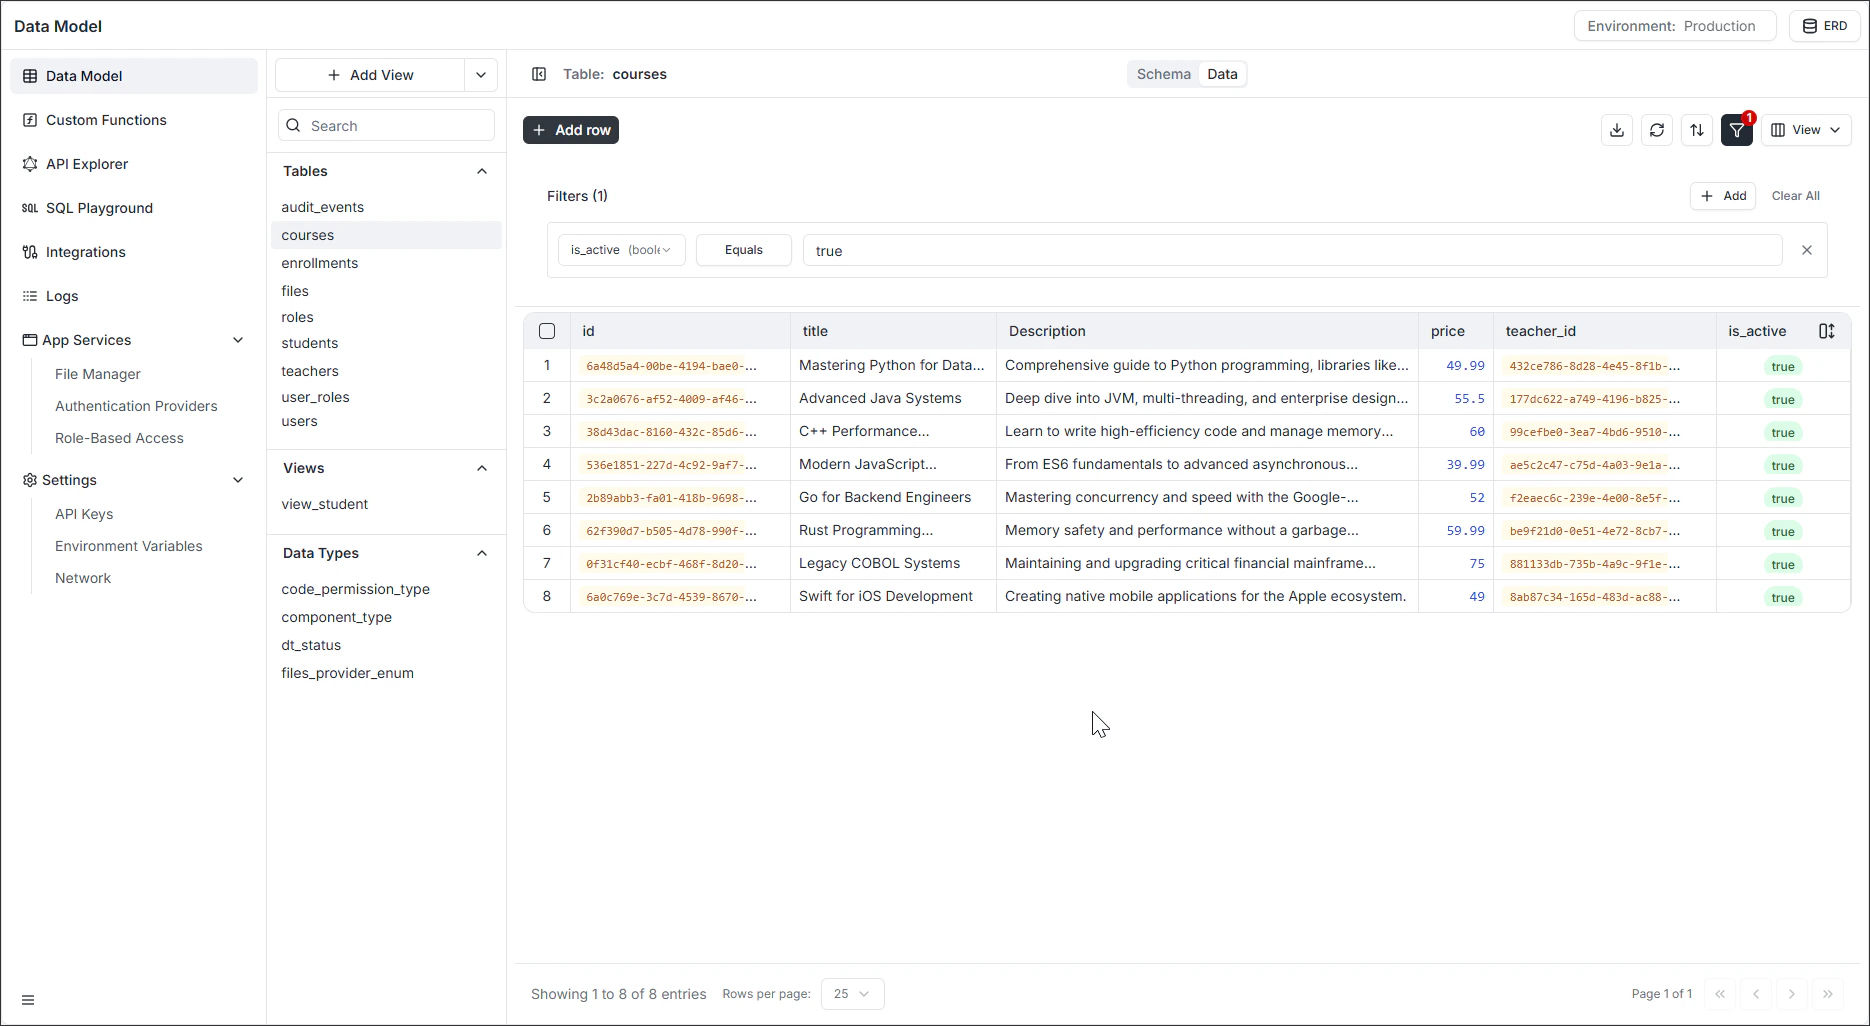
Sorting
Click the sort icon (up/down arrows) in the toolbar to add sort attributes. You can sort on multiple columns; the order in which you add them determines the priority.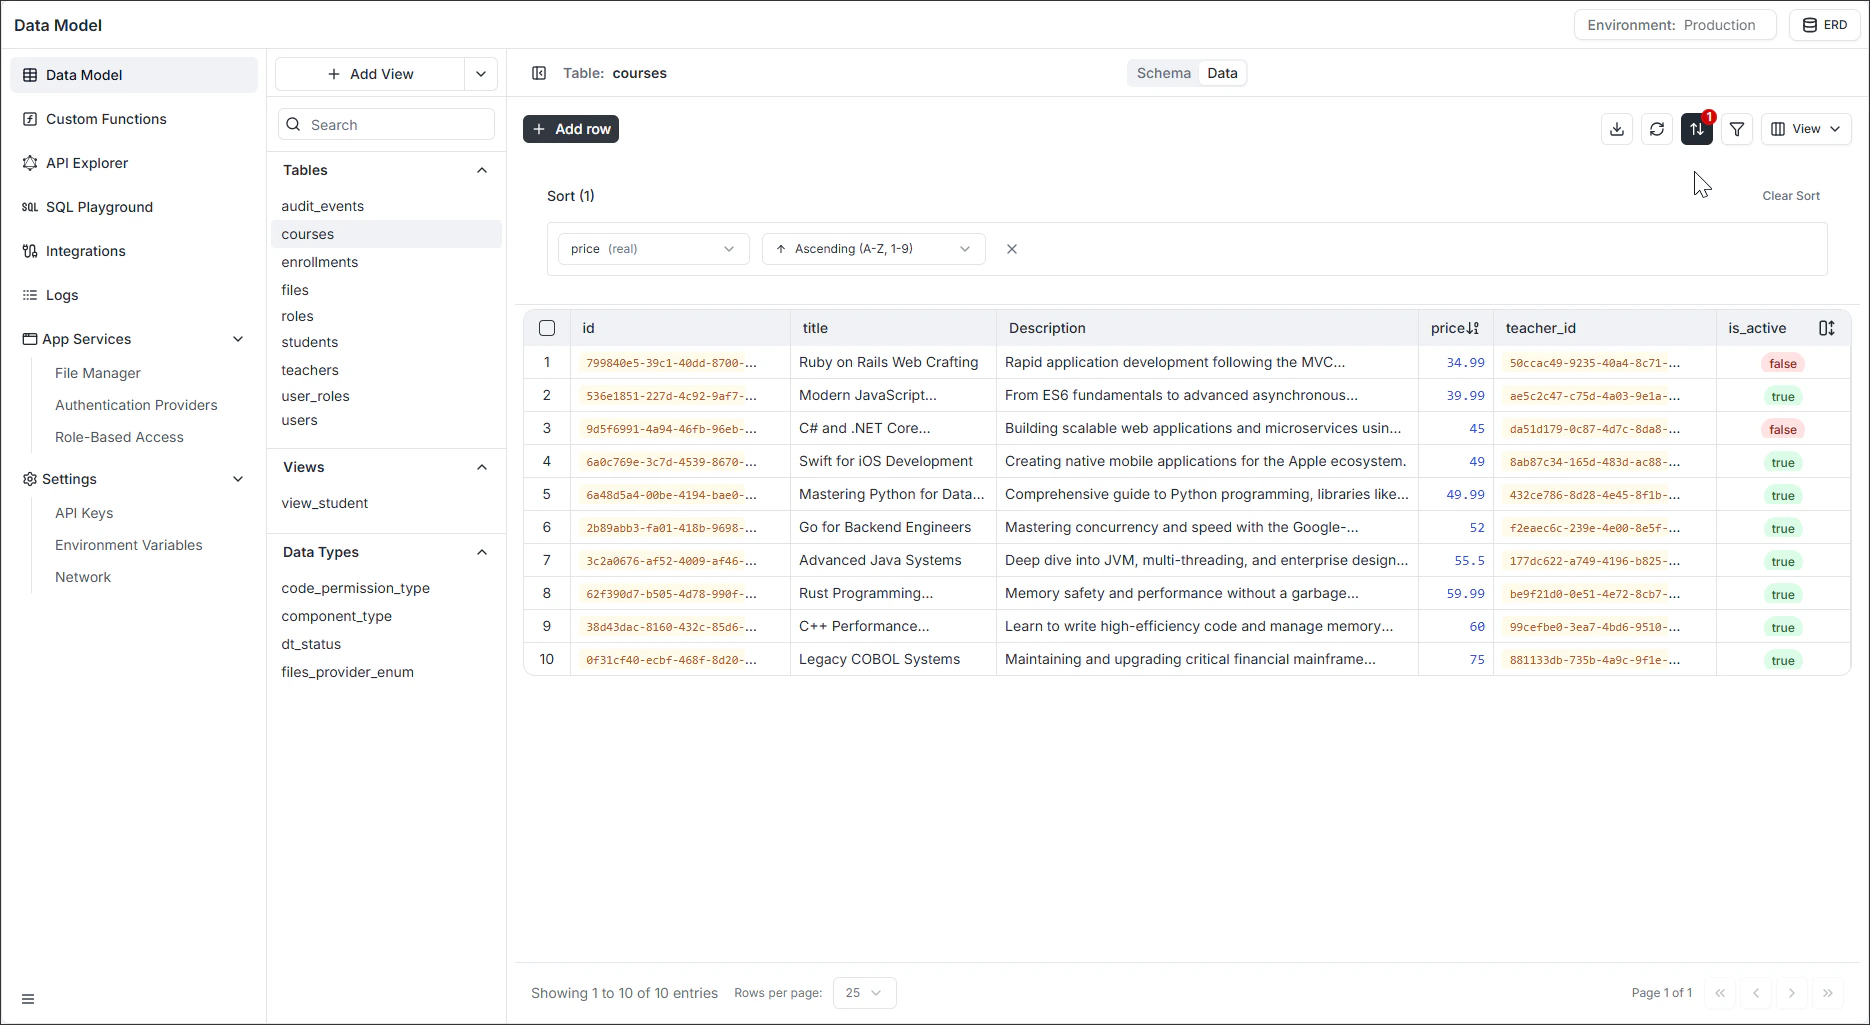
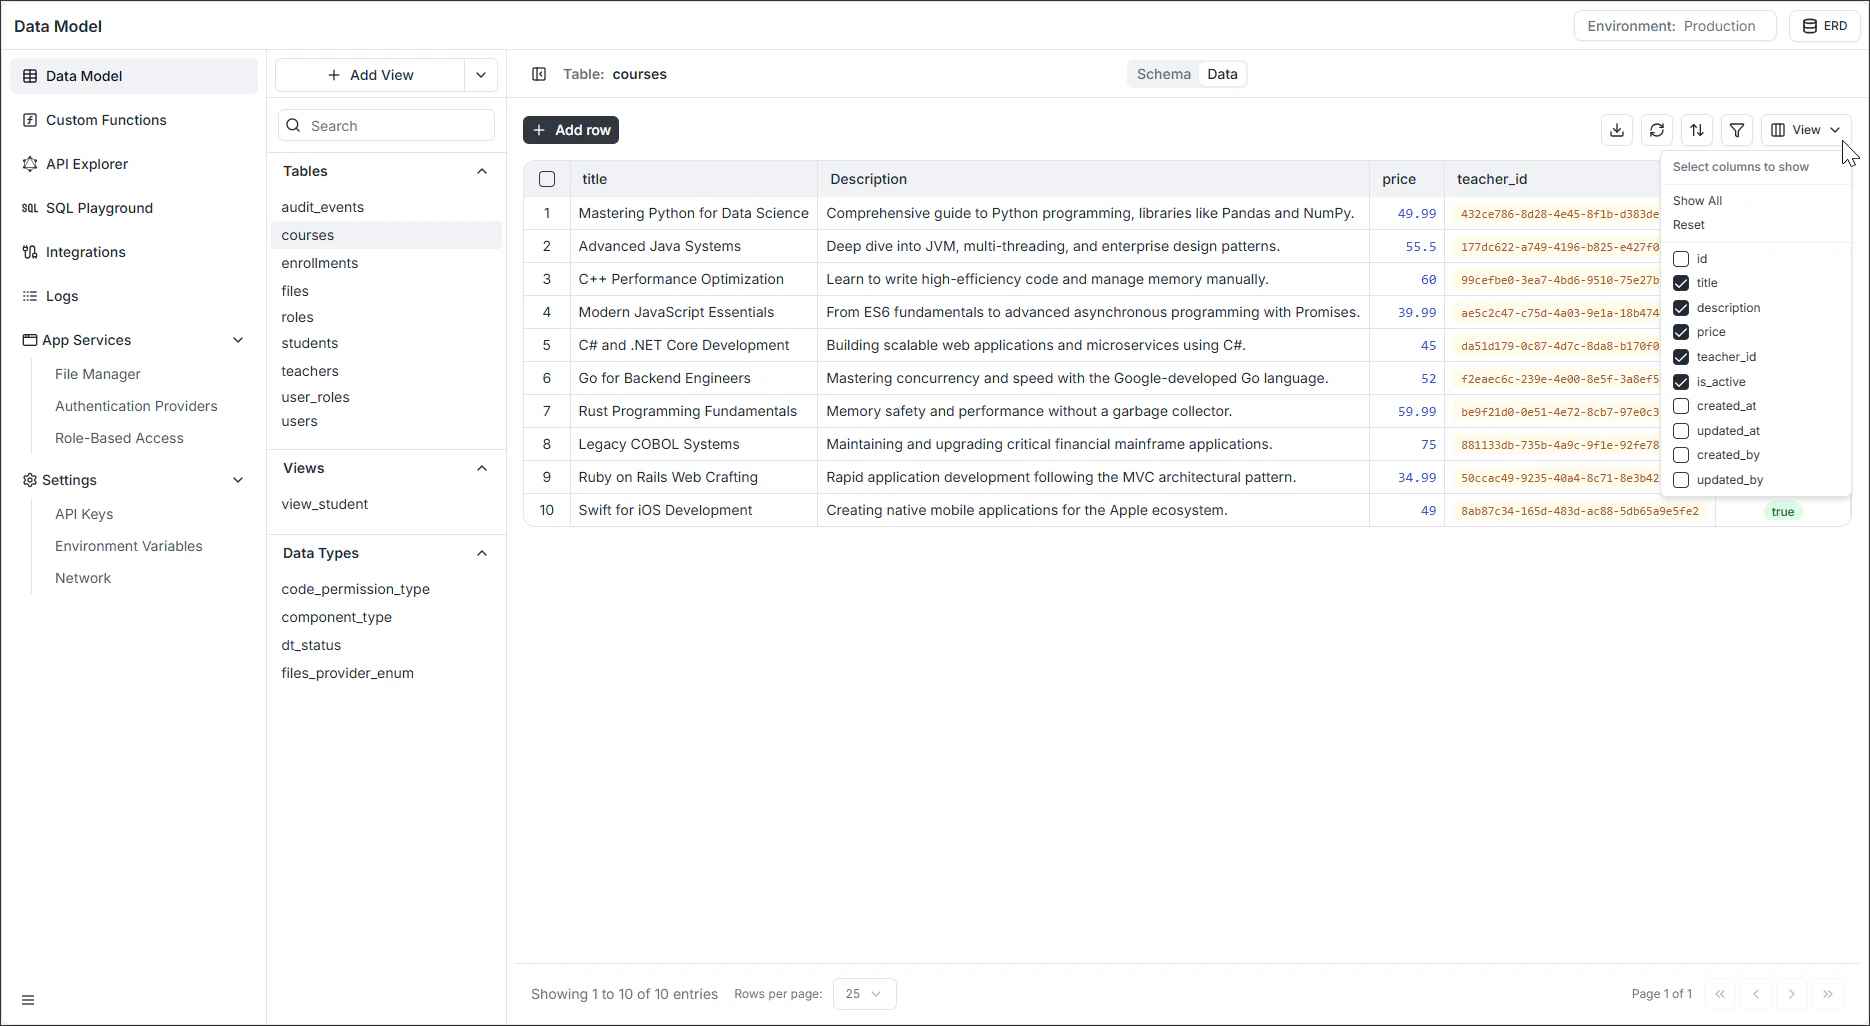
Showing and hiding columns
Click View in the toolbar to toggle which columns are visible in the grid. Audit columns —id, created_at, created_by, updated_at, updated_by — are hidden by default. Use Show all to bring them back, or Reset to return to the default view.
Importing and exporting
The Data Viewer toolbar has dedicated controls for moving data in and out via CSV:- Importing data — upload a CSV, map columns, validate against the schema.
- Exporting data — download the current filtered view as CSV.
Permissions
Whether a user can read, add, edit, or delete rows — and whether specific fields are visible to them — is governed by Role-Based Access. The Data Viewer respects those rules: a field hidden from your role is hidden in the grid; a delete action you don’t have permission for is unavailable.FAQ
What happens if my edit violates a uniqueness constraint?
What happens if my edit violates a uniqueness constraint?
The save fails and an inline error tells you which constraint was violated. The row stays in edit mode so you can fix the value.
Is the Data Viewer safe to use against production?
Is the Data Viewer safe to use against production?
Edits go through the same validations as the API, but anything you delete is gone. Use environments to keep production isolated — see Environments.
Can I bulk-edit rows from the Data Viewer?
Can I bulk-edit rows from the Data Viewer?
The Data Viewer edits one row at a time. For bulk updates, use a custom function or the SQL Playground.